
Have you ever needed to count unique things like transactions or customers? Of course you have, and counting things is thankfully very straightforward in the Power Pivot universe, just use DISTINCTCOUNT('Harry'[BulletId]) and you’re done.
Have you ever needed to count lots and lots of things though? Maybe billions of things? You can still use the same function but the sheer amount of data itself may present a different challenge, especially if you’re working with Excel (or Power BI Desktop).
Thankfully, if you’re willing to trade some accuracy for more data points (or more information perhaps) there’s an excellent option. If you can live with an error of say ±2%, you can use the HyperLogLog algorithm to estimate the number of distinct elements in your data set.
This post lays out how to implement HyperLogLog in Power Pivot or Power BI, and in a way that is surprisingly easy. And to be clear, we will maintain the ability to drill and slice our data just like we normally would. In fact, apart from some loss of accuracy we’re making no concessions whatsoever, i.e. we’re not introducing any additional complexity to the model.
We’ll start with the why-this-works though, and please bear with me as it will get a bit geeky (or interesting, your choice).
HyperLogLog to the rescue
The HyperLogLog algorithm has been around since 2007, you can find the original research paper here if you’re that way inclined. It builds on prior work along a similar vein; the problem itself, counting lots of things, is nothing new.
The main principle behind the LogLog family of algorithms is as follows…
The cardinality of a multiset of uniformly distributed random numbers can be estimated by calculating the maximum number of leading zeros in the binary representation of each number in the set.
Thanks Wikipedia, that really cleared things up!
What’s key here is the fact that in a random binary number the chance of a zero in any given position is 50/50, or a coinflip. And, if I told you I just flipped 10 heads in a row you’d probably assume I’d been busy flipping for quite a while. So, just like when flipping coins, if we’ve observed a long sequence of leading zeroes in a group of numbers, chances are we’ve searched through a lot of different numbers (i.e. the more leading zeros, the greater the count).
So, with random independent 0’s and 1’s it’s not surprising to hear that the second half of the Wikipedia paragraph above reads:
If the maximum number of leading zeros observed is n, an estimate for the number of distinct elements in the set is 2n.
This approximation might strike you as quite naive, and it is. HyperLogLog doesn’t quite end there, to minimise variance we group the numbers into buckets and work with a harmonised mean of the most significant bit. The more buckets, the more accurate but also more data to keep in memory ultimately.
The number of buckets will be a factor of 2n, i.e. 1, 2, 4, 8 and so on. To get an error rate around ±5% we have to go up to 512 buckets. Of course, if we don’t have enough numbers we won’t fill all buckets but that’s OK.
Preparing our data
First step in implementing this solution is to get our hands on some random numbers. Chances are we’re counting something like users or orders with an identifier attached, and in this example we’ll count unique orders from the Contoso FactOnlineSales table. More specifically, we’re going to aggregate sales and quantity by store, week and product subcategory while maintaining an approximate count of orders across all permutations. Even though we’ve chosen to work with less granular data we’ll still have a very rich data set.
If you don’t have access to a SQL Server instance with this dataset, you can still follow along using the same principles with any suitable dataset (but bear in mind the SQL statements below apply to SQL Server).
First things first, unless our ID’s just happen to be random integers (usually 32 or 64-bit) we need transform them into just that. Unfortunately, there’s really no obvious way of generating these using Power BI or Power Query (that’s to say there is a way, it’s just a bit clunky). Most of the time you can do this first step in your database however, which is what we’re going to do using SQL Server.
My inspiration for this solution came from a pure SQL implementation of HyperLogLog and from there we’re going to borrow the first few steps, namely creating buckets and calculating the most significant bit for each bucket. We will tweak the SQL slightly (this was originally done in PostgreSQL) but I would advise you to read this post for a more detailed explaination of each step.
What we want to do first is to generate a numeric hash of the order number. A hash is a random number or string but the output is always the same for the same input, i.e. in our use case different lines on the same order will generate the same hash. There’s no obviuos way of generating a numeric hash in SQL Server so we’ll do this in a few different steps.
Hashbytes is a function which will generate (in this case) a 256-bit string, that’s too long to convert to an integer so we’ll use the following cast to ‘truncate’ the value at 4 bytes (32 bits, matching SQL Server’s integer type).
cast(
  hashbytes(
    'sha2_256',
    cast(SalesOrderNumber as varchar(max))
  )
  as binary(4)
)
This then, is the binary version of our hash. To convert this into an integer we’ll do a bitwise & operation with 231-1 which is the largest 32-bit integer (i.e. consecutive 32 1’s). This will also force all integers to be positive, which is a requirement later on when calculate the logarithm of them.
cast(
  hashbytes(
    'sha2_256',
    cast(SalesOrderNumber as varchar(max))
  as binary(4)
) & 2147483647
In this case we’ll aim for an error rate around ±5% so we’ll use 512 buckets, the bucket numbers will range from 0-511 so to generate a bucket number we’ll use the following:
cast(
  hashbytes(
    'sha2_256',
    cast(SalesOrderNumber as varchar(max)) as binary(4)
  )
) & 511 as bucket_number
Our query will be grouped by this bucket number along with any other attributes we want to capture. To calculate the most significant bit by bucket number we’ll use this:
31 - floor(
  log(
    min(
      cast(
        hashbytes(
          'sha2_256',
          cast(SalesOrderNumber as varchar(max))
        ) as binary(4)
      ) & 2147483647
    ),
    2
  )
) as bucket_msb
Ok, we’re nearly there, we’re nearly at the point where the DAX/PowerPivot magic starts. Still with me? This is our final SQL query which we’ll use in our data model:
use ContosoRetailDW
select
  dd.CalendarWeek
  ,fos.StoreKey
  ,dp.ProductSubcategoryKey
  ,cast(hashbytes('sha2_256', cast(fos.SalesOrderNumber as varchar(max))) as binary(4)) & 511 as bucket_number
  ,sum(fos.SalesAmount) as sales_value
  ,sum(fos.SalesQuantity) as sales_volume
  ,31 - floor(log(min(cast(hashbytes('sha2_256', cast(fos.SalesOrderNumber as varchar(max))) as binary(4)) & 2147483647), 2)) as bucket_msb
from dbo.FactOnlineSales as fos
inner join dbo.DimDate as dd on
  fos.DateKey = dd.Datekey
inner join dbo.DimProduct as dp on
  fos.ProductKey = dp.ProductKey
group by
  dd.CalendarWeek
  ,fos.StoreKey
  ,dp.ProductSubcategoryKey
  ,cast(hashbytes('sha2_256', cast(fos.SalesOrderNumber as varchar(max))) as binary(4)) & 511
The output of this query should look something like this:
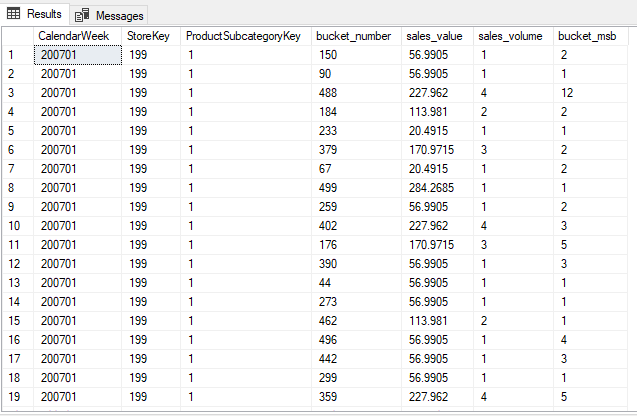
The query will generate around 1.3 million rows compared to the 12.6 million in the complete table. We’re trading accuracy for compactness and performance, time to fire up Excel or Power BI!
Let DAX to its magic
Let’s translate the final part of the HyperLogLog algorithm into DAX. Key to this is the fact that HyperLogLog’s ‘merge function’ (i.e. aggregate) is simply max. If we want to aggregate the approximate order count for a category of products, or all products we need to group the buckets and look only at the largest bucket_msb.
Approximate Order Count =
VAR m = 512 // Number of buckets
VAR a = 0.7213 / (1.079 / m + 1) // Bias correcting constant
// 'Merge' the current context, we're aggregating by always working with the highest MSB in each group
VAR MergeTable =
    GROUPBY(
        HLL,
        [bucket_number],
        "max_msb",
        MAXX(CURRENTGROUP(), [bucket_msb])
    )
VAR EmptyBuckets =
    m - COUNTROWS(MergeTable)
VAR ApproximateCount =
    DIVIDE(a * m^2, SUMX(MergeTable, 2^-[max_msb]) + EmptyBuckets, 0)
VAR FinalCount = IF(
    ApproximateCount < 2.5 * m && EmptyBuckets > 0,
    a * m * LOG(m / EmptyBuckets, 2),
    ApproximateCount
)
RETURN IF(
    FinalCount = 0,
    BLANK(),
    ROUND(FinalCount, 0)
)
The workhorse of this formula is the MergeTable variable. By continously regrouping the current context by bucket_number and calculating the maximum value of bucket_msb mapping the formula is very straightforward.
So, what’s the output? This, for example:
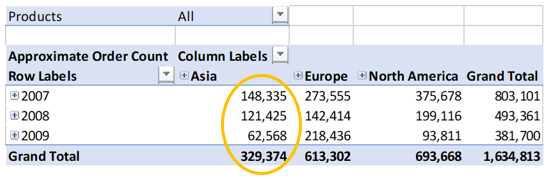
What you’ll notice is that each row and column total does not equal the sum of their parts. This is because the context of the calculation is different in each cell and produces a different approximation. We can ‘remedy’ this by aggregating up from store and day (assuming orders don’t trancend time and space):
Approximate Order Count (Adjusted) = SUMX(
  GENERATE('Calendar','Stores'),
  [Approximate Order Count]
)
Using this updated measure we get a more intuitive result where the sum of each region/year combination equals the grand total:
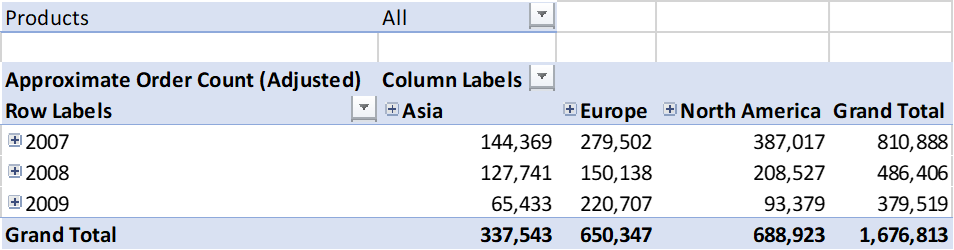
This may well result in a less accurate approximation but will make more sense to a consumer of the data.
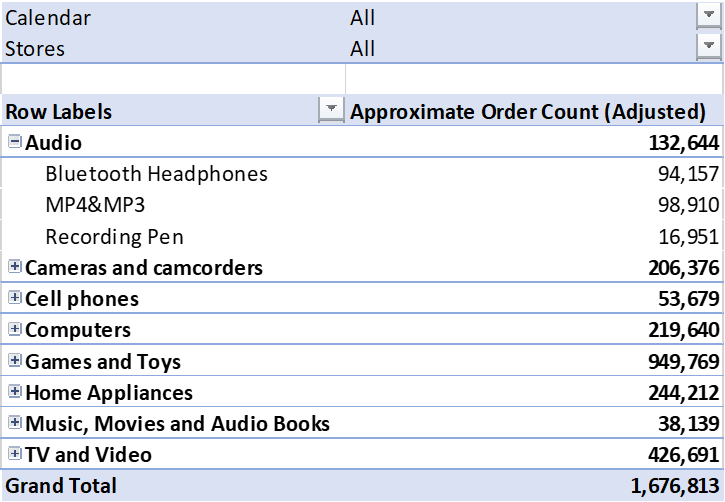
Looking at product categories we find that the sum does not match the total or subtotal, as expected with individual orders spanning multiple product categories.
That’s it for now, I will revisit this post however in a part two where I compare the accuracy of this technique vs. the DAX function APPROXIMATEDISTINCTCOUNT. This new function is available in DirectQuery mode vs. SQL Server 2019 or Azure SQL Data Warehouse. Spoiler: What we’ve just accomplished here using Excel is nearly as accurate.
In the meantime, please leave a comment below if you find this useful, if you come across any issues or suggestions for improvements.
Here’s a sample Power BI file containing the queries, data and formulas in this post.