
You can’t have too many metrics!
…no one ever said (and if they did, they shouldn’t have). You absolutely can have too many metrics, yes I’m talking to you.
That being said, here’s another one: the Gini coefficient. This may ring a bell, it is traditionally used to measure income inequality within a population so it regularly crops up in the news, articles etc. Technically there’s no reason we can’t use this to measure inequality in other domains, but why would we do that?
It’s all about the eggs to baskets ratio: The main reason that Gini is useful is that inequality often is an excellent proxy for risk.
Using the Gini Coefficient
The Gini coefficent usually takes a value between 0 and 1, with 0 being totally equal (e.g. everyone earns the same) and 1 is the complete opposite (one individual accounts for all income in the population).
What if, instead of income, we calculate the Gini coefficient over a population of customer accounts and their billings and play with idea that our coefficient comes out close to 1, what does that tell us?
It tells us that our top customers account for a disproportionate amount of revenue, and more tangibly that we’re in serious trouble if a) we lose our top customers or b) our top customers can’t pay.
Similarly, if close to all your inventory value is tied to only a few items there’s risk, or if close to all of your sales are coming from only a few members of your sales team (there’s another risk).
All these things the Gini coefficient can help us identify. What it cannot do is tell you where to draw the line between risk/no risk, this has to be a subjective decision based on domain knowledge and good judgement.
You may for instance decide that, as it stands, you have a number of larger clients that account for the majority of revenue. Your business could withstand losing a few of them without suffering any major consequences and the current ratio between smaller/larger clients suit your current organisation well. If your coefficient is then 0.75, you could simply monitor this and decide to review should it deviate more than .05 points in either direction.
That’s merely one example, and there are no hard and fast rules. Give it a go to see if you can determine what ‘healthy inequality’ looks like in your organisation or domain.
Implementing Gini Coefficient in DAX
To use the coefficient in Excel or Power BI we perform some DAX magic, but let’s first have a look at the coefficient in a bit more detail.
The Gini coefficient is dervied from the Lorenz Curve. This is the cumulative distribution of income or wealth plotted on the Y-axis against the percentile of the population (in ascending order) on the X-axis.
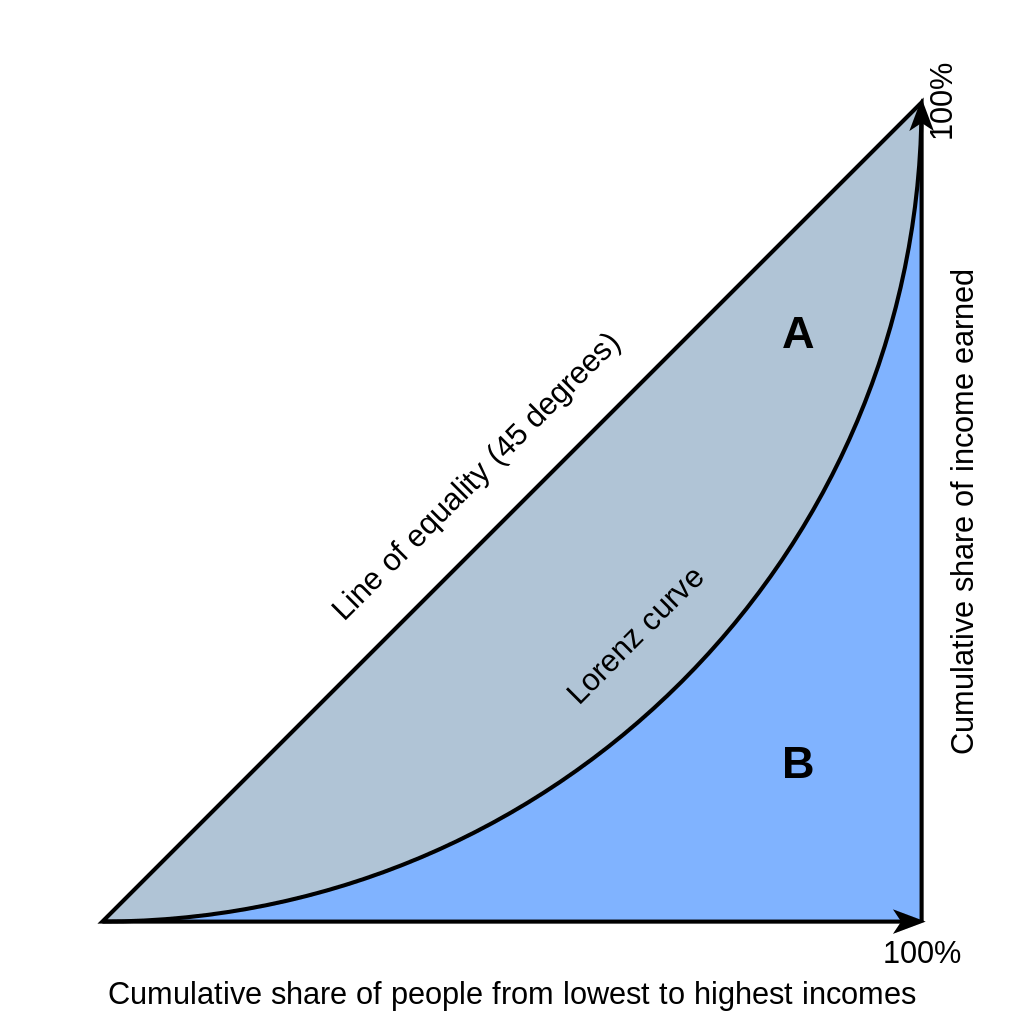
The Gini coefficient is simply the ratio between A (i.e. the difference between reality and total equality) and A + B (the total area).
With a DAX implementaion in mind, the most straight forward way of expressing the Gini coefficient is:
\[G = {{ 2 \sum_{i=1}^n iy_i } \over { n \sum_{i=1}^n y_i }} - { n + 1 \over n}\]n is simply the number of items in our population, i is their rank (in ascending order) and y is whatever value, e.g. income, we’re basing the coefficient of.
The crux of this calculation is the rank–we’re after the sumproduct of rank and value over whatever attribute we’ve decided to measure the inequality of.
Please let me know in the comments if you can think of a more efficient way of doing this, but here’s how I implemented Gini in DAX:
Gini Coefficient = IF(
  HASONEVALUE('DimTable'[Attribute]),
  1,
  VAR RankedTable = ADDCOLUMNS(
    CALCULATETABLE('DimTable'),
    "i",
    RANKX('DimTable', [MyMetric], , ASC, Dense)
  )
  VAR n = COUNTROWS(RankedTable)
  RETURN DIVIDE(
    2 * SUMX(RankedTable, [i] * [MyMetric]),
    n * SUMX(RankedTable, [MyMetric])
  ) - DIVIDE(n + 1, n)
)
E.g. if you want to measure the sales inequality among products, swap DimTable for DimProduct, or whatever your table is called, and [Metric] for [Sales]. And depending on what your data looks like you may want to filter the table to exclude inactive products, former employees etc.
Example Workbook
You can download an example workbook here with Contoso data. It becomes very apparent that Contoso is a ficticious company when seeing the extreme equality between products, there appears to be neither runaway bestsellers nor disasters.
I have a very hard time seeing this pattern being repeated in any succesful retailer (think inefficient stock handling etc.) As a closing thought then, I would like to add that the apparent abscence of risk… is also a risk.